Ever since humans began living by the sea, it was well known that the height of the sea-level changed. Sometimes the tide was low with vast stretches of beach exposed; sometimes the beach was covered by meters (if not tens of meters) of sea water. People quickly learned that the sea would rise and fall twice per day and that the times of high water and low water occurred sometime later each day.
Early sailors were not unobservant. In fact, their continued survival depended on observing the numerous details of ocean motions. Thus, they had determined that:
- The times and heights of high and low water were variable. One day the sea surface might rise from low water to high water in seven or more hours (a seven-hour duration) but, several days later, the tide might take only five hours to rise from low to high.
- When the “duration” of a tide was short, the change in height (the range) was also small.
- When the “duration” of a tide was long, the “range” was large.
- The most extreme tides occurred around the time of the full and new moons; spring tides and tidal ranges were much less at times of the first and last quarter moons.
- The highest and lowest tides occurred in December/January and in June/July.
- Low tides occurred during the day in the summer and at night in winter.
- Along a particular coastline, high water would occur later in one direction, and earlier in the opposite direction, as if a wave was moving along the coast.
- Some locations experienced a single tidal oscillation per day (from low water to high water and back again). These tides were called “diurnal tides.” Elsewhere, however, there would be two complete tidal oscillations per day (semi-diurnal tides). In yet other places, there would be a mixture of tidal oscillations, sometimes diurnal and sometimes semi-diurnal.
People learned that it was relatively easy to predict the times and heights of the tides a few days in advance, but it was not so easy to make accurate predictions further than that.
However, when Sir Isaac Newton discovered the force of gravity, an explanation of the tidal force was provided—the tides were caused by the gravity of the sun and the moon. His explanation, though, fell short in that it described tidal effects on a uniform ocean without continents or deep ocean basins. As a result, this explanation could not provide a basis for accurate prediction of the tides.

Monahan image
Whether the sun and moon exert gravitational force in the same direction or in opposite directions the effect is similar. The tidal “bulge” in the envelope of water around the earth is greatest, and the tides are the highest of the lunar cycle (spring tides). Because the tidal “bulge” is raised on both sides of the planet, an observer at the equator would notice two high tides and two low tides per day.

Monahan image
When the sun and moon exert gravitational force at right angles to each other (first and last quarter), the tides are the lowest of the lunar cycle (neap tides).
Pierre-Simon Laplace, a French astronomer and mathematician, finally developed a dynamic theory of tides in 1775. In the dynamic model, the various tide-producing forces raise “tidal” waves in the oceans with periods equal to the periods of the generating forces. In the Pacific Ocean, these “tidal” waves circulate around a central node near to the Hawaiian Islands. As a result, the tides in Hawaii are very small, having a maximum range of less than three feet (0.9 meters). These tidal waves interact with the underwater topography of ocean ridges, seamounts and continental masses, creating yet more complexity.

Monahan image
Continental land masses and ocean-bottom topography do not allow the tide to flow smoothly around the world. Instead, tidal “waves” are generated which propagate around ocean basins. When the crest of the wave passes a place, the tide there is high.

Monahan image
If the orbit of the moon was precisely above the equator, and if the earth’s axis was not inclined from the sun, then the calculation of tides would be simple. Twelve hours later, point “A” would be at position “B” and would experience a high tide of approximately the same magnitude. But that is very seldom the case, so the tidal oscillation is very complex.
The dynamic model also takes into account the fact that the Earth’s equatorial plane is tilted 23.5° to the plane of its orbit around the sun and the Moon’s orbit around the Earth is tilted a further 5°. The result is that the moon is sometimes directly overhead from 28.5° north of the equator to 28.5° south—a variability of 57°. This explains the inequality of the two high and two low tides each day and demonstrates why the inequality is greatest when the declination of the moon is greatest.

Monahan image
The Earth’s axis is tilted 23.5° to the plane of the Earth’s orbit around the sun and the Moon’s orbit is inclined a further 5°. As a result of this, the tidal bulge will be very unequal in height between points A and B. 12 hours after one high water, point “A” will have moved to position “B” and will experience a high tide of very different magnitude.
The dynamic model shows that each of the various forces that raise the tides can be represented by a sine curve with different periods. Each of these sine curves is one of the many constituent curves that contribute to the final harmonic curve of the tides at a specific location. Among the many periodic forces which generate “constituent curves” are:
- The rotation of the moon around the Earth. Because the moon rotates around the Earth in the same direction as the rotation of the Earth, it is approximately 24 hours and 50 minutes before the moon is directly overhead on two successive days.
- The revolution of the Earth around the sun (365 days).
- The wobble of the Earth’s axis (lunar nutation) caused by the inclination of the moon’s orbit (18.6 years).
- The natural oscillation period of the ocean basin.
- The natural oscillation periods of coastal bays, sounds and gulfs.
To understand the way these oscillation periods work together, consider that the Bay of Fundy has a natural oscillation period of about 12.5 hours. Because this is very close to the natural half-lunar period of the tides, the two oscillations reinforce each other, producing some of the highest tides in the world.
By 1876, scientists knew most of the forces that control the tides. For most locations, there are 37 or more constituent curves which must be combined to create the final harmonic curve which can be used to accurately predict tidal times and heights. The calculations, however, are complex and laborious. To perform the calculations for multiple locations was not feasible until the brilliant scientist Sir William Thompson (who later became Lord Kelvin) had a chance meeting with the inventor and engineer Beauchamp Tower in a railway carriage enroute to a meeting of the British Association. The conversation turned to the possibility of building a tide-predicting machine that could combine multiple sine curves into a single final harmonic curve. Tower suggested using the principle of a chain passing around a number of pulleys as in an “alphabetic telegraph instrument”. As Lor Elgin wrote, “This proved the very thing wanted.”
The result was the Kelvin Tide-Predicting Machine, an analogue computer which remained in use as the principal means of generating tide predictions for almost a century.
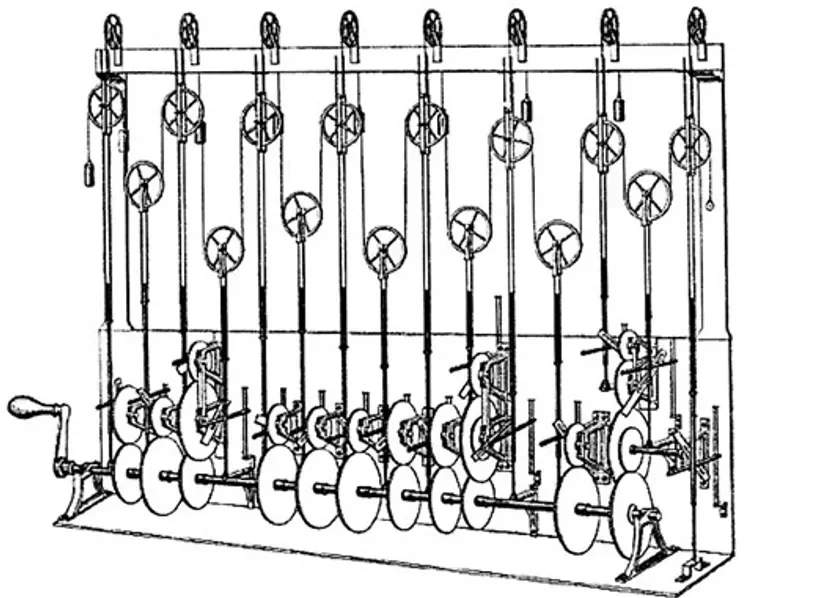
The Kelvin Tide-Predicting Machine; Original sketch by Lord Kelvin
Each constituent curve is represented by a pulley with a diameter proportional to the period of the constituent. By turning a crank at one end, a stylus at the other end records the resultant harmonic curve on a moving strip of paper. The paper can then be examined and measured to find the times and heights of high and low water.
Article by Kevin Monahan of Shipwrite Productions


